Learning how to debug code isn't just a technical skill; it's a mindset. It’s about methodically hunting down the source of an error, isolating the problem, and then figuring out the right way to fix it. This process transforms debugging from a moment of pure frustration into a solvable puzzle.
Why Effective Debugging Is a Superpower
We've all been there. Staring at the screen, absolutely convinced the code is perfect. It should work. But it doesn’t. That feeling of hitting a brick wall is what separates a junior developer from a seasoned pro. The secret isn't writing bug-free code—that's a myth. The real skill is getting incredibly good at finding and squashing the bugs you inevitably create.
When you start to see debugging as your most valuable asset instead of a mind-numbing chore, everything changes. It’s not just about fixing something broken anymore. It becomes a journey of discovery that forces you to understand the system you're building on a much deeper level.
The Mindset of an Expert Debugger
The heart of great debugging isn't about memorizing every tool in the box. It’s about cultivating the right mindset, one built on curiosity, patience, and a methodical approach. An expert doesn't just throw their hands up and ask, "Why is this broken?" Instead, they ask a more powerful question: "What assumption did I make that turned out to be wrong?"
"The fixes proposed by a coding agent with debugging capabilities… will be grounded in the context of the relevant codebase, program execution and documentation, rather than relying solely on guesses based on previously seen training data."
That quote gets to the core of it. Solid debugging is about gathering evidence, not making wild guesses. Every bug is a clue, a breadcrumb leading you to a fundamental truth about how your application is actually behaving, not just how you think it's behaving.
More Than Just Fixing Errors
Getting good at debugging pays dividends that go far beyond fixing the immediate problem. It fundamentally improves how you write code.
- You'll Ship Faster: The quicker you can diagnose an issue, the less time you'll spend stuck. Less time hunting for bugs directly translates to more time building and shipping new features.
- Your Code Gets Tougher: Every bug you fix is a lesson learned. It teaches you what not to do next time, creating a powerful feedback loop that makes your future code far more resilient.
- You'll Understand the Big Picture: Nothing teaches you a codebase faster than having to trace a bug through its darkest corners. Debugging forces you to explore parts of the system you'd otherwise never touch, giving you an invaluable, holistic understanding.
This skill is so vital it’s become a massive industry in its own right. The global market for software debugging was pegged at $15 billion in 2025 and is only expected to climb. That number reflects the sheer complexity of modern software and the immense value companies place on shipping quality, stable products. You can dive deeper into these market trends and the growth of debugging tools.
In this guide, we'll give you the foundational strategies to turn you into that debugging powerhouse everyone wants on their team.
Your Initial Framework for Finding Any Bug
Every developer knows the feeling. Something’s broken, and you have no idea where to start. It's tempting to jump in and start changing code randomly, but that’s a fast track to frustration. A solid, repeatable process is what separates a quick fix from a multi-hour nightmare. This is about creating a deliberate plan to move from "it's broken" to a clear, actionable path forward.
First things first: you absolutely must be able to reproduce the bug reliably. If you can't make the error happen on demand, you'll never know if your fix actually worked. This is non-negotiable. Document the exact steps, the specific user inputs, or whatever conditions trigger the failure. This becomes your baseline, your single source of truth for testing.
Forming Your Hypothesis
Once you can trigger the bug at will, it's time to play detective and form a hypothesis. This isn't a wild guess. It's an educated assumption based on the evidence you have so far.
Let’s say an image fails to load, but only for certain user accounts. A good starting hypothesis would be, "The image URL for premium users is probably being built incorrectly, and the system is getting a null value instead."
This back-and-forth of guessing and then proving (or disproving) your guess is the very heart of debugging. We've all been there, stepping through code line-by-line with a debugger, watching variables change until we find the exact moment things go wrong.
To test your hypothesis, you need to gather evidence. This doesn't have to be complicated. Sometimes, a few simple console.log or print statements are the fastest way to see what's happening. In our image URL example, you'd log the variable right before it’s used and check the output for both a regular user and a premium user. The answer will likely be staring you right in the face.
The image below shows what this looks like in practice, with a debugger paused on a line of code, letting you inspect everything.
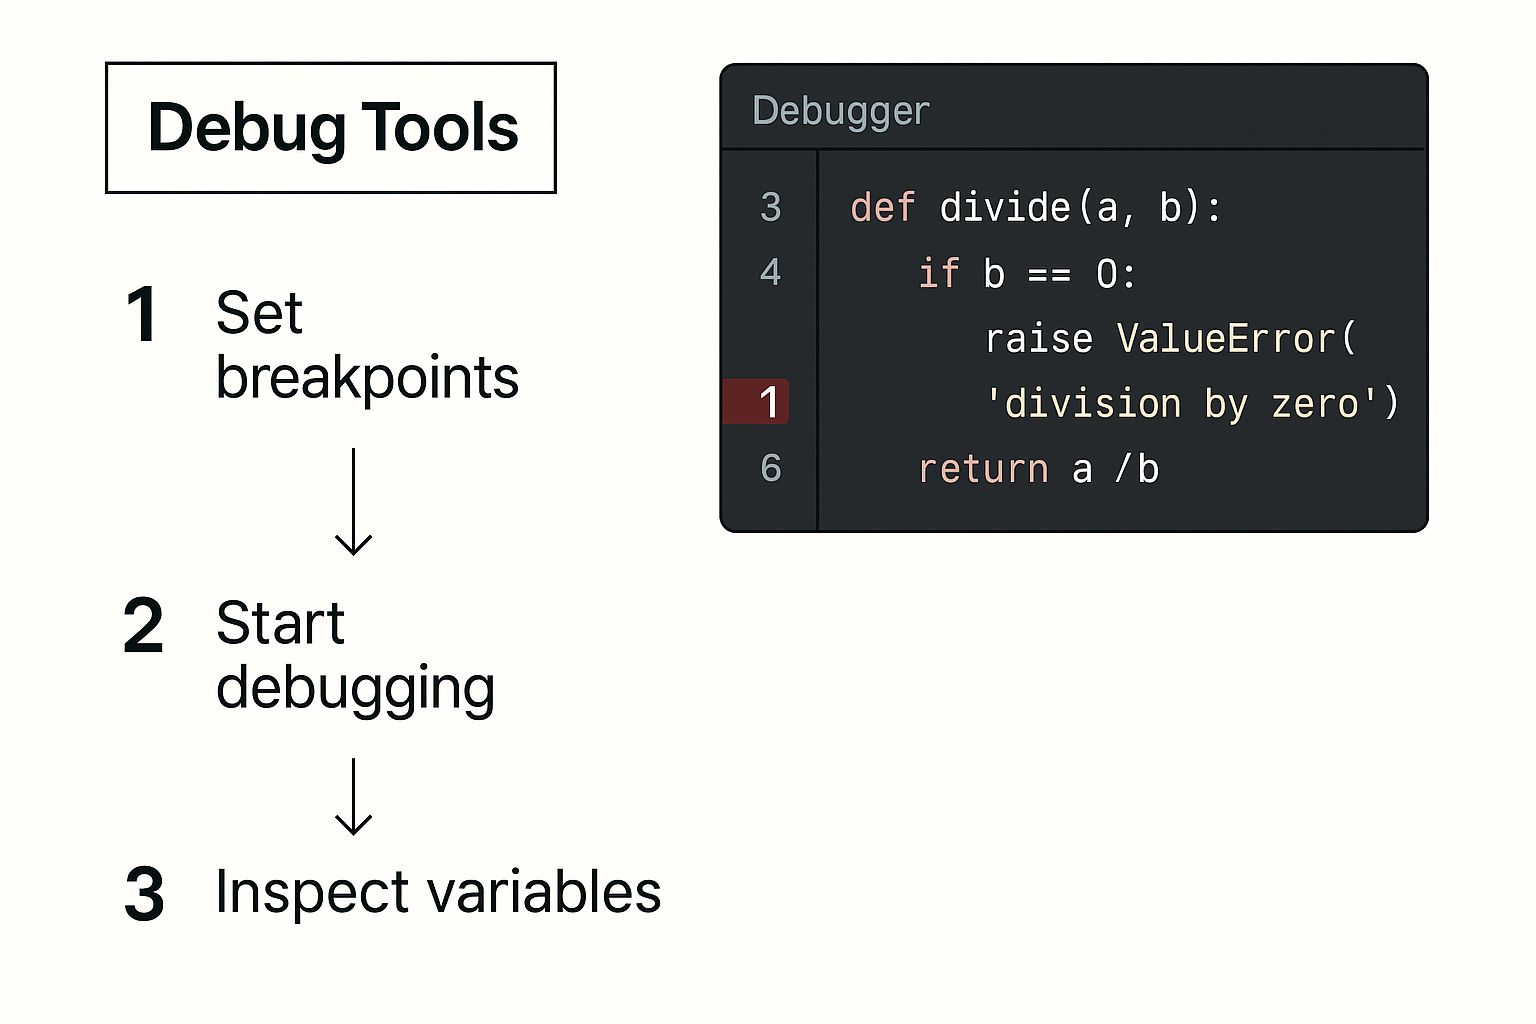
Being able to freeze your application at a specific moment is incredibly powerful for confirming whether your hypothesis is on the right track.
Gathering Evidence Systematically
Let's walk through another classic problem: a CSS style is being mysteriously overridden. Your hypothesis might be that a more specific selector somewhere else in the stylesheet is taking precedence. To gather evidence, you’d pop open your browser's developer tools, inspect the element, and look at the "Computed" or "Styles" tab to see the entire cascade of rules being applied. The browser will literally show you which rule is winning.
This process gives you a simple, repeatable loop:
- Observe the Anomaly: A button click does nothing.
- Reproduce Consistently: Realize it only fails on mobile after scrolling.
- Form a Hypothesis: "I bet an overlapping transparent element is hijacking the click event."
- Test and Gather Evidence: Use the element inspector to check for overlays or use logs to see if the event handler is even firing.
- Analyze and Refine: If the handler is firing, the problem is inside the function. Your old hypothesis was wrong, but the new evidence gives you a better one to test.
This methodical approach transforms debugging from a frantic art into a calm, systematic science.
To help you get started, here's a quick-reference table summarizing the core actions to take the moment you encounter a bug.
Core Debugging Actions at a Glance
| Action | Objective | Example |
|---|---|---|
| Reproduce the Bug | Create a reliable test case to confirm the bug's existence and validate the fix. | Follow a user's exact steps: Log in as User X, navigate to the dashboard, click the "Export" button. |
| Form a Hypothesis | Make an educated guess about the root cause based on observable symptoms. | "The export fails because the data-fetching query is timing out for large datasets." |
| Gather Evidence | Use tools to test the hypothesis and uncover the actual state of the application. | Add logging to measure the query's response time or use a debugger to inspect variables. |
| Analyze and Refine | If the hypothesis is wrong, use the new information to form a more accurate one. | The logs show the query is fast, but an error is thrown during data formatting. New hypothesis: A null value is causing the formatting function to crash. |
This framework, combined with the right tools, gives you a confident starting point for squashing any bug that comes your way. While print statements are great, a full-featured debugger can seriously accelerate your evidence gathering. For some powerful options, check out our curated directory of the best developer tools for vibe coding projects (https://www.vibecoding.vip/tools/) and find the one that fits your workflow.
Moving Beyond Prints: Mastering Your Debugger
Let's be honest, we've all leaned on print() statements. They're the trusty multitool in every developer's back pocket for getting a quick peek inside our code. But relying on them for serious bug hunting is like trying to perform surgery with a pocket knife. To really level up your debugging game, you need to embrace a proper debugger. It's the difference between fumbling in the dark with a flashlight and seeing everything with a full set of X-ray glasses.
A debugger gives you the power to pause your program at any point, poke around inside its memory, and see exactly what's going on. You can walk through your code line-by-line, watching variables change and logic unfold. It's a level of control that print() just can't match. You’re no longer just seeing a single snapshot; you're watching the entire movie in slow motion, frame by frame.
Unlocking Your Debugger’s Superpowers
Modern code editors like VS Code or JetBrains IDEs have incredibly powerful, built-in debuggers that are much easier to get started with than you might think. Once you get the hang of a few core features, you'll wonder how you ever lived without them. The most fundamental concept to grasp is the breakpoint.
Simply put, a breakpoint is a marker you place on a line of code. When your program hits that line, it stops dead in its tracks, handing control over to you. This freezes time, letting you examine everything: local variable values, complex objects, and the entire state of your application at that precise moment.
But what about those really tricky bugs? The ones that only pop up after a loop has run 500 times? Setting a simple breakpoint and hitting "continue" 500 times would be maddening. That's where conditional breakpoints come in. You can tell the debugger to only pause when a specific condition is true, like i === 500 or user.name === null. Now you're not just debugging; you're performing surgical strikes on your bugs.
The real art of debugging is a cycle: form a hypothesis about why something is breaking, then use your tools to gather evidence to prove or disprove it. It's this detective work that builds deep, lasting understanding of your own code.
Tracing the Path of an Error
Another feature you absolutely need to know is the call stack. When your program eventually crashes (and it will), the call stack is your treasure map. It shows you the exact sequence of function calls that led right up to the error. Think of it as a trail of breadcrumbs leading you directly to the scene of the crime. By walking back up the stack, you can trace a problem from its symptom all the way back to its root cause.
This is what a typical debugging session looks like. You can see the breakpoints marked in the gutter and the call stack laid out on the left.
This visual layout is incredibly intuitive. It lets you click on different functions in the stack to see what the local variables looked like at each step, giving you a complete picture of where things went off the rails.
Finally, most debuggers let you set up watch expressions. These are specific variables or expressions you want to keep a close eye on. As you step through your code, the debugger constantly updates their values for you. It's perfect for spotting the exact moment a variable gets an unexpected value.
Proactive Tools for Cleaner Code
Of course, the best way to fix a bug is to prevent it from ever being written. This is where linters become your first line of defense. Linters are static analysis tools that scan your code as you type, flagging potential errors, stylistic messes, and common bad practices before you even hit "run."
These tools are invaluable for catching those simple but frustrating mistakes we all make:
- Using a variable before it’s been declared.
- Forgetting a closing bracket or parenthesis.
- Inconsistent formatting that makes the code a nightmare to read.
AI-powered tools are taking this proactive approach even further. For example, you can learn more about how GitHub Copilot can help you write cleaner code by spotting subtle issues and suggesting better patterns in real-time. By building these tools into your daily workflow, you create a safety net that drastically cuts down on frustrating bug hunts later on.
Advanced Strategies for Unsquashable Bugs
Sooner or later, you'll run into a bug that just refuses to be fixed. It's the kind of problem that's intermittent, buried deep in the system, or only shows up under the strangest conditions. When your standard debugger isn't cutting it, you have to dig deeper and pull out some more advanced tactics.
One of the most powerful, and frankly underused, techniques is what I call binary search debugging. This isn't about searching your code; it's about searching your commit history. Let's say a feature worked perfectly last week but is mysteriously broken now. Instead of manually sifting through dozens of commits, you can let Git do the heavy lifting.
The git bisect command is a lifesaver here. You simply tell Git a "good" commit (where everything worked) and the current "bad" commit. From there, Git checks out a commit right in the middle and asks you to test it. You mark it as good or bad, and Git cuts the remaining commit range in half again. This continues until you've zeroed in on the exact commit that broke the build. It's incredibly fast and precise.
The Surprising Power of Talking to a Duck
This next one sounds a bit silly, but I swear by it: rubber duck debugging. The idea is simple. You grab an inanimate object—a rubber duck is traditional, but a coffee mug works too—and you explain your code to it, line-by-line.
You're not expecting the duck to give you a brilliant insight, of course. The magic happens when you're forced to verbalize your thought process and justify every decision in your code. The simple act of explaining the "why" behind each line often makes you stop and say, "Wait a second, that doesn't make any sense."
By articulating the problem, you engage a different part of your brain. This simple shift in perspective is often all that's needed to see the obvious flaw that was hiding in plain sight.
Tackling System-Level Failures
Modern applications add whole new layers of complexity. Debugging a single function is one thing, but what happens when you’re hunting down a race condition in a multithreaded app or a failure that cascades through a dozen microservices? These system-level headaches require a more holistic view.
- Race Conditions: These are the bane of any developer's existence because they depend on the unpredictable timing of operations. The best way to tackle them is with meticulous logging. You need to log every interaction with the shared resource to reconstruct the exact sequence of events that led to the conflict.
- Distributed Systems: In a microservices world, a single user click can set off a chain reaction across multiple services. When something breaks, finding the root cause can feel impossible without the right tools. Centralized logging and distributed tracing are non-negotiable. They let you trace a single request's entire journey, showing you exactly where things went sideways.
The sheer complexity of today's software means debugging is a constant battle. We only need to look at historical examples, like the Sendmail vulnerability discovered back in 2003, to see how a subtle flaw in an address-checking function can lie dormant for years. That incident is a stark reminder of how tough it is to spot issues in massive systems. If you're curious, you can find more details about this historical bug on USENIX.org.
Writing Code That Prevents Bugs
So far, we've talked a lot about what to do after a bug shows up. But what if we could stop most of them from ever happening in the first place? That's the real pro move. Shifting your focus from reactive debugging to proactive prevention is the single best thing you can do for your code and your sanity.
It all starts with writing clean, readable, and well-documented code. Think of it as your first and strongest line of defense. When you write code that’s simple and self-explanatory, you do your future self—and anyone else who works on the project—a massive favor. Potential issues just seem to pop out when the code's intent is clear at a glance.
This isn't just a "nice-to-have." It's becoming a business necessity. As software gets more complex, the cost of fixing bugs skyrockets. The global software debugging market is on track to hit USD 7.2 billion by 2032, a figure driven by the desperate need for more efficient development. You can dig into the numbers yourself on the projected growth of the software debugging market. This data paints a clear picture: building quality in from the start saves a ton of time and money.
Build a Robust Testing Safety Net
A solid testing strategy is like an automated safety net for your project. It’s always there, catching mistakes and ensuring that your latest feature didn't just break something completely unrelated. This isn't about just one kind of test, though. You need a few layers to be truly effective.
- Unit Tests: These are your foundation. They're small, lightning-fast tests that focus on a single, isolated piece of your code, like one function. They confirm the basic building blocks of your logic are solid.
- Integration Tests: This is where you check if different parts of your app can talk to each other. Can your API module actually pull data from your database module? Integration tests have the answer.
- End-to-End (E2E) Tests: These are the big picture tests. They simulate a real user's journey through your application, from clicking a button in the UI all the way down to a record being saved in the database. They catch the sneaky bugs that only appear when everything is running together.
Layering these tests creates a powerful system that flags problems for you, often before you even know they exist. This can drastically cut down on the time you spend manually hunting for bugs. If you want to see what this looks like in practice, we've curated some examples of well-structured codebases with tests that you can learn from.
The Value of Peer Code Reviews
Never, ever underestimate the power of a second pair of eyes. Peer code reviews—where another developer on your team looks over your code before it gets merged—are an absolute game-changer.
A code review is more than just a quality check; it's a knowledge-sharing session. It spreads understanding of the codebase across the team and often uncovers logical flaws or edge cases the original author might have missed.
Honestly, this collaborative process is one of the most effective ways to catch bugs before they ever make it to users. It builds a culture of shared ownership where everyone feels responsible for the quality of the code.
By making these practices—clean code, smart testing, and thorough reviews—a regular part of your workflow, you’ll build far more resilient software and win back all that time you used to lose to debugging.
Let’s Tackle Some Common Debugging Questions
Every developer, no matter how seasoned, hits familiar snags. The real trick to getting better at debugging isn't just about knowing tools, but about having solid answers to those nagging questions that pop up time and again. Let's walk through a few of the most common ones I hear and share some practical advice that has helped me get unstuck.
What’s the Very First Thing I Should Do When I Find a Bug?
Before you even think about touching the code, your one and only goal is to reproduce the bug reliably. Seriously, stop and figure out how to make it happen on demand.
This step is non-negotiable. If you can't trigger the bug consistently, you're just guessing. A reliable reproduction case proves the bug is real and, more importantly, gives you a baseline to test against. Once you think you've fixed it, you'll run that exact same test to prove you were right.
So, write down the exact steps you took. What data did you use? What buttons did you click? This repeatable setup is your most powerful weapon.
I Have No Clue Where to Start. What Now?
We've all been there—staring at a bug with absolutely no idea where it's coming from. When this happens, don't panic. Just start broad and systematically narrow things down.
Think of it as a "divide and conquer" mission. I usually start by peppering print statements or setting breakpoints in major, high-level functions. My goal is just to get a bird's-eye view of the data flow. Is the data what I expect it to be at each major checkpoint?
Sooner or later, you'll find the spot where things go off the rails—where the actual state of your application diverges from what you thought it should be. That’s your ground zero.
At its heart, debugging is a simple loop: Form a theory, test it with your tools, and study the results. This evidence-based process turns a frustrating mystery into a puzzle you can actually solve.
It feels way more scientific than just randomly changing code and hoping something sticks, because it is.
Are Print Statements a Bad Way to Debug?
Not at all! In fact, sometimes a quick print statement (or console.log in the JavaScript world) is the fastest way to get a sanity check on what your code is doing. For a quick peek at a variable's value, it’s often the best tool for the job. They're a totally legitimate part of any developer’s toolkit.
But they have their limits. Once you need to track multiple variables at once, see the entire call stack that led to a problem, or pause your code to poke around, a real debugger becomes infinitely more powerful.
Knowing when to use which is a sign of experience:
- Stick with
printstatements for simple, one-off checks. - Fire up a full debugger when you need to do some serious detective work on complex logic or application state.
The most effective developers I know are fluent in both. They use the simplest tool that gets the job done and aren't afraid to switch to something more powerful when the situation calls for it.